After analyzing 220 samples of Highland beef for shear force, cooking loss, fatty acid profile and sensory difference testing via the triangle testing method, we have learned two important pieces of information regarding the beef that was submitted for testing. First, as we might expect, but now we are certain that the fatty acid profile of Highland beef is strongly influenced by region and diet. Cattle finished on varied forages or corn soy diets will exhibit varied fatty acid profiles. These profiles will f it different consumer demands and palates. Therefore, the marketing of the cattle feeding system becomes important and has potential to provide premium pricing. The key is to find the niche that your system best fits. I have had conversations with some Highland producers over the course of this study that are utilizing this flavor aspect as a marketing tool.
While flavor is a major driver in beef eating satisfaction, tenderness can make or break the repeat purchase. To this end, our data has shown that Highland beef is very tender according to shear force values. This tenderness is consistent in cattle up to 30 months of age with a minimum carcass aging of 10 days in the cooler. I believe this is the most marketable piece of information that we have attained. I also think that this is a marketable characteristic as some Highland breeders seek to utilize their germplasm for crossbreeding systems and breed complimentarity.
What the future holds for Highland breeders is obviously up to the individual. However, some logical next steps for Highland beef assessment could take different forms. The first of these steps could be a sire progeny test. This would require breeders to identify bulls that are impacting the breed and to assess the performance of their progeny in contemporary group testing. Thus, specific sires or sire lines can be identified for performance of their progeny specifically to sell purebred Highland beef from feedlot cattle that optimize growth, performance, and carcass merit.
Secondly, the opportunity exists to identify Highland genetic lines that compliment other breeds and to use these lines as outcross genetics. Hybrid vigor or heterosis could be optimized with other breeds less related to Highland especially in those traits that are moderate to highly heritable such as growth (weaning weight and postweaning gain) and carcass traits (ribeye area, fat depth, carcass weight, and marbling).
As with any type of livestock production system, the future sits with the current producers and the leadership of their respective organizations. It seems those that are able to move forward and experience success are groups that use sound science, proven management practices and an open line of communication with all the stakeholders.
MATERIALS AND METHODS
Sample Selection and Steak Processing
Producers were asked to send in a submission form, two ribeye steaks, and one package of ground beef per animal sampled for this study. The submission form contained animal identification, sex, birth date, slaughter date, carcass weight, primary finishing diet, days on finishing diet, length of time at processor before slaughter, carcass aging time, and region of production. The ground beef was to be sent in one pound units and from a single animal and not have added trim from other animals. The steaks were to be boneless, 2.54 cm thick and cut from the 12th rib portion of the rib and moving forward toward the 11th rib. Once samples were received they were kept frozen until tested. A small piece (roughly 25g) of the lateral end of the 12th rib steak was removed for fatty acid analysis.
The rest of that steak was used for Warner-Bratzler shear force (WBSF). The 11th rib steak was used for sensory panel and the ground beef was used for fatty acid analysis. Beef Sample Cooking All 12th rib steaks were thawed for 48 h at approximately 4ºC prior to cooking. Prior to cooking, a raw weight was obtained for each steak. Steaks were cooked on a Presto® Tilt’n Drain Griddle at 150ºC. Steaks were cooked to an internal temperature of 35ºC, flipped, and then cooked to a final internal temperature of 71ºC. Steak internal temperature was monitored using a hand held thermometer with a probe (HH-21, Omega Engineering, Stamford, CT). After cooking, a cooked weight was obtained. Cook yield was determined as a percentage using the following formula: (cooked weight/raw weight) x 100. Steaks were cooled at refrigerated temperature, approximately 4ºC, for 24 h. Warner-Bratzler Shear Force For each steak six 1.27-cm cores were removed parallel to muscle fiber for WBSF. All shear forces were performed on the United STM Smart-1 Test System SSTM-500 (United Calibration Corp., Huntington Beach, CA). Settings for WBSF test speed was 250 mm/min and SSF test speed was 500 mm/min.
Fatty Acid Analysis
The methodology utilized for fatty acid determination was an adaptation of the methods used by Folch et al. (1957) and Morrison and Smith (1964). Approximately 1g of sample was placed in a glass tube and 5 mL of chloroform:methanol solution (CHCL3:CH3OH, 2:1, v/v) was added to the tube in order to extract lipids. The sample was homogenized for 30 seconds using an Omni International 2000 homogenizer (Waterbury, CT, U.S.A.). The sample was then filtered through a sintered glass filter funnel fitted with a Whatman 2.4 cm GF/C f ilter and 8 mL a solution of 0.74% KCl was added to the tube. The sample was allowed to sit for 2 h to separate the phases and then the upper phase was removed and discarded. The lower phase was then transferred to a glass tube and evaporated to dryness with nitrogen gas in a heated water bath at 70ºC using a Meyer N-Evap Analytical Evaporator (Organomation Associates Inc., Berlin, MA, U.S.A.). 1 mL of 0.5 N KOH in MeOH was added to the sample and the tube was placed in a water bath at 70ºC for 10 min. Then, 1 mL of 14% boron trifluoride (BF3) in MeOH was added to the tube, flushed with nitrogen, loosely capped and placed in a water bath at 70ºC for 30 min. After 30 min, the sample was cooled to room temperature and 2 mL of HPLC grade hexane and 2 mL of saturated NaCl was added to the tube. Next, the upper layer was removed and placed in a glass tube with approximately 800 mg of Na2SO4 in order to remove moisture from the sample. Following this, 2 mL of hexane was added to the tube with saturated NaCl and once more, the upper layer was removed and placed in the same tube with Na2SO4. The liquid portion was then transferred to a scintillation vial which was placed in a water bath at 70ºC and the sample was evaporated with nitrogen. A Varian 420 gas chromatograph (Varian, Pala Alto, CA, U.S.A.) was used to analyze fatty acid methyl esters; samples were injected onto a fused silica capillary column (SPTM – 2,560; 100 m x 0.25 mm x 0.2 µm film thickness; Supelco, Bellefonte, PA, U.S.A.). The temperature of the injector and of the flame-ionization detector was held constant at 240ºC and 260ºC, respectively. Helium was used as the carrier gas at a constant pressure of 37 psi and the oven was operated at 140ºC for 5 min (temperature programmed 2.5ºC/min to 240ºC and held for 16 min). Fatty acids were normalized which means that the area of each peak was represented as a percentage of the total area. Iodine value (IV) was determined based on the equation described by AOCS (1998): IV = (0.95 × C16:1) + (0.86 × C18:1n9) + (1.732 × C18:2n6) + (2.616 × C18:3n3) + (0.785 × C20:1). This method was performed in duplicate for both ground beef and steak samples
Sensory Panel
The sensory panel was approved by the University of Missouri Campus Institutional Review Board (IRB) (Project Number 1207916). Highland samples were compared to a commodity ribeye steak using a triangle test. All 12th rib steaks were thawed for 48 h at approximately 4ºC prior to cooking. Commodity steaks were purchased as Beef Rib, Ribeye, Lip-On (IMPS 112A) and cut to the same thickness as the Highland steaks (2.54 cm). Steaks were cooked on a Presto® Tilt’n Drain Griddle at 350ºC to an internal temperature of 35ºC, f lipped, and then cooked to a final internal temperature of 71ºC. Steak internal temperature was monitored using a hand held thermometer with a probe (HH-21, Omega Engineering, Stamford, CT). Once cooked, steaks were cut into 1 cm cubes using a gridded cutting board and two cubes were placed on a toothpick as a representative of that steak. A random plating assigned was issued where either two Highland and one commodity or one Highland and two commodity samples were placed on each plate and labeled as A, B, or C. Panelists were instructed to indicate the sample that was different than the other two. Each steak was sampled by 8 unique panelists.
Statistical Analysis
Data was analyzed using the Statistical Analysis Software (SAS, 2010) Cary, NC. The GLM procedure of SAS was used to determine main affects for sex of animal, geographic regions and primary finish diet. Least squares means and standard errors were estimated. Significance was set at P < 0.05 for means and are presented in the right hand columns of each data table. Sensory data was analyzed by estimating the likelihood that a sensory panelist was able to detect the sample that was different among the three samples presented in each triangle test. Percentage of panelist detecting differences by breed or diet are presented as means across the sensory panel via pie chart.
Characterization of All Cattle in the Data Set (Mean Values)
- 828 days of age (27 mo)
- 40% received some grain in finishing
- 571 lb carcass weight
- 9 hrs. lairage prior to slaughter
- 17.5 days carcass aging
- 3.6 kg shear force
RESULTS AND DISCUSSION
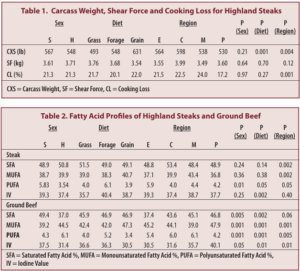 Animals represented in this data set (n=220) are characterized in the preceding bulleted statements. It is no surprise that the average live weight and subsequent carcass weight is small compared to U.S. beef industry averages. Highland cattle are not considered a large frame breed and thusly would not be expected to produce heavyweight carcasses. The average carcass weight of 571 lbs would still f it in the low end of commercially produced beef should producers want to sell their cattle in this manner. Table 1 shows carcass weight, shear force and cooking loss data by sex of animal, predominant finishing diet type, and region of the country. The factors that sort animals for carcass weight are not surprising in that steers are heavier than heifers and grain fed animals are heavier than grass or forage finished animals. From a management standpoint, 40% of the cattle in this study received some grain during the finishing phase. This would be much lower than traditionally finished beef in the U.S. and reflects the more forage based nutrition plans utilized by producers that provided cattle for the study. While this approach is certainly acceptable, it does create a situation where many of the Highland cattle were much older than the majority of fed cattle presented for slaughter in the U.S. The longer finishing period resulted in an average age at slaughter of 27 months. The only concern that some might have in this scenario is that the average age at slaughter is close to 30 months which triggers some concerns for managing and processing beef for bovine spongiform encephalopathy (BSE). Cattle slaughtered under inspection that exhibit age over 30 months (typically by dentition) will need to be processed differently in that their spinal cord and other specified risk material (SRM) must not be compromised in the carcass breaking processes. These cattle over 30 months of age cannot qualify for export to many countries as well.
When considering the carcass aging process and the subsequent Warner-Bratzler shear force indicators of tenderness, we find the carcasses in this study were aged an average of 17.5 days and showed an average shear force value of 3.6 kg in the ribeye muscle as sampled at the 12th and 13th rib interface. This period of aging would most likely optimize the post-mortem proteolysis process where the actin and myosin structures within the muscle matrix would break down and provide a tender product as indicated by the relatively low shear force value. The literature indicates that aging beef a minimum of 10 days will provide optimal carcass tenderness, but long time aging will result in water loss in the carcass if the aging method is a dry process. Long time aging of wholesale cuts in a vacuum bag (wet aging) will improve cut yield, but will slow the overall aging process. Therefore, it is imperative to match the retail pricing with the aging method employed by beef producers and processors.
Table 2 summarizes the fatty acid profiles of Highland beef for ribeye steak samples and for ground beef samples. The literature indicates that one would expect grass fed and forage fed beef to have lower percentages of saturated fats and greater polyunsaturated fats. Thus, reflecting the “oil” content of their diet. The data in this study follows that logic in that in general forage fed animals had higher percentages of polyunsaturated fats with grass fed and grain fed animals producing fat profiles intermediate and lower to forage fed animals, respectively. The forage finished diets would be more concentrated in polyunsaturated fats compared to grass since these forages are most likely hay or silage based and would have much lower water content at the time of intake for the cattle. In some niche markets, beef producers might use the increased unsaturation as a marketing tool for their beef. However, it is important to note that higher percentages of unsaturated fats are more susceptible to oxidation and will likely exhibit a shorter shelf life both fresh and frozen.

Figures 1 and 2 show the results of the triangle sensory test where panelists were asked if they could determine which sample was different among three total samples where two of the samples were the same. Figure 1 indicates that panelists could not determine (89%) the ribeye steak sample that was different when commodity beef (high select quality grade) was compared to Highland beef. These results indicate that the commodity beef and the Highland beef maintained similar sensory profiles. It is important to note that a triangle test does not measure preference only difference. Figure 2 indicates the comparison between the predominantly grass finished vs the predominantly grain finished beef. In this scenario, panelists were able to discern the sample that was different 71% of the time. Again, this comparison does not measure if the panelist preferred grass or grain finished beef, but only that one of the samples of the three presented was different from the other two samples.
CONCLUSIONS
The genetic nature of Highland cattle in this study provide for a smaller than average beef carcass with more than acceptable Warner-Bratzler shear force values indicating a likely tender eating experience. Certainly, purebred Highland cattle are fitting into the beef system in the U.S. as indicated by the geographic representation of the breed. These cattle will continue to serve many niche markets as some consumers seek heritage-type meat sources in smaller portion sizes. It is important to note however, that Highland cattle vary greatly from many other breeds produced in the U.S. There would be opportunities to cross-breed them to produce moderately framed, lower input genetic types that provide an overall tender eating experience in a steak that may not be highly marbled, thusly, taking advantage of a tender, lower fat content beef product.